
Making data-driven investment decisions is the process of using quantitative data analysis, technology tools, and disciplined frameworks to guide your investments rather than relying on intuition alone. Individual investors in 2026 have access to the same raw signals that once belonged exclusively to institutional traders, from SEC filings and congressional trades to AI-driven financial analysis. The gap between retail and institutional investing has never been smaller, and the investors closing that gap are the ones who treat data as their primary input. This article shows you exactly how to do that, step by step.
How to make data-driven investment decisions: the foundational tools
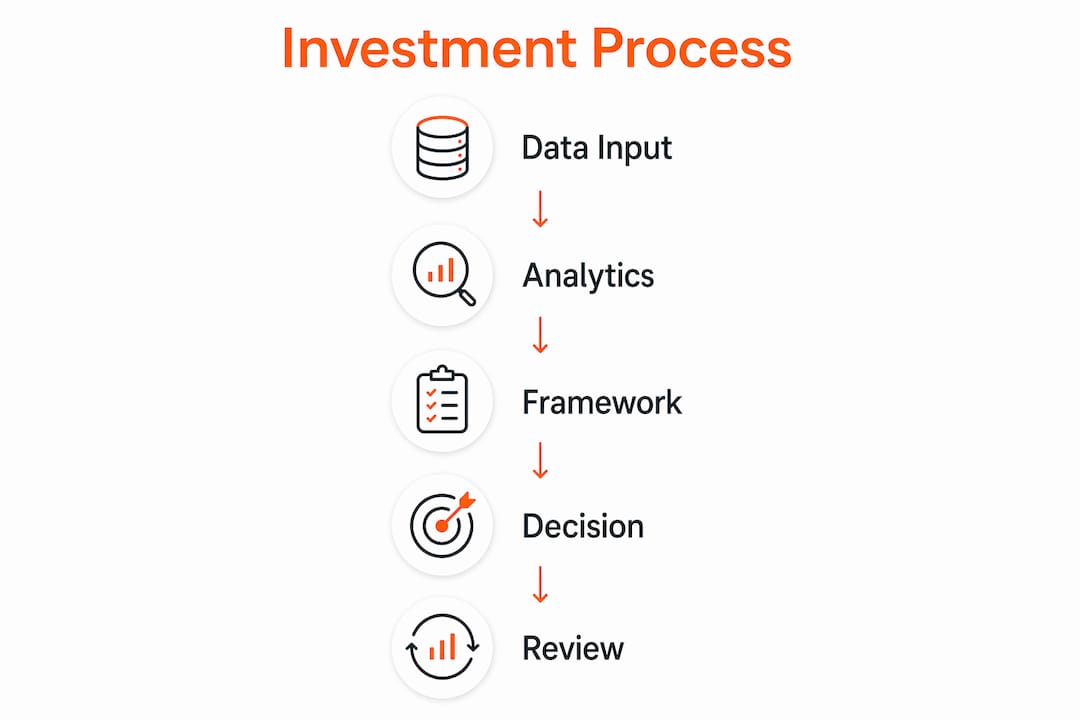
Every data-driven investing practice starts with three inputs: reliable data sources, practical analytics tools, and a framework for turning numbers into decisions. For individual investors, the most accessible data sources are brokerage statements, SEC filings through EDGAR, and structured financial news from sources like Reuters and the Wall Street Journal. These give you the raw material. What you do with it determines your edge.
The table below compares tools across experience levels so you can match your setup to your current skill and data volume.
| Tool type | Beginner option | Advanced option | Best for |
|---|---|---|---|
| Spreadsheet analytics | Microsoft Excel, Google Sheets | Python with pandas library | Ratio analysis, trend tracking |
| Financial dashboards | Morningstar, Yahoo Finance | Bloomberg Terminal alternatives | Portfolio monitoring, screening |
| AI document processing | Adobe Acrobat AI | CambioML | Parsing 10-Ks, earnings reports |
| Relationship intelligence | LinkedIn, personal CRM | Affinity, Salesforce | Deal sourcing, network leverage |
| Signal aggregation | Manual news tracking | Kresmion | SEC filings, whale movements, macro regime data |
AI-first tools outperform manual extraction by more than 40 hours of labor per 1,000 unstructured financial documents processed. That number matters because most individual investors spend their time gathering data instead of analyzing it. The right tool stack flips that ratio.

Pro Tip: Start with one data source and one analytics tool. Mastering Google Sheets with SEC filing data will teach you more in three months than juggling five platforms will in a year. Complexity is the enemy of consistency.
How do you analyze financial data to evaluate investments?
Financial data analysis for investors follows a repeatable sequence. The steps below apply whether you are evaluating a single stock or stress-testing a full portfolio.
- Collect your data. Pull financial statements (income statement, balance sheet, cash flow statement) from SEC EDGAR or your brokerage. Confirm the data covers at least three to five fiscal years.
- Run ratio analysis. Calculate return on equity (ROE), net profit margin, current ratio, and debt-to-equity. These four ratios tell you whether a company is profitable, solvent, and efficiently managed.
- Identify trends. Compare ratios year over year. A rising ROE combined with a falling profit margin often signals a company growing revenue while losing pricing power. That is a warning sign most investors miss.
- Forecast conservatively. Use historical growth rates to project revenue and earnings two to three years forward. Apply a discount rate that reflects your required return, not the company's optimistic guidance.
- Distinguish signal from noise. Financial analytics automates reporting and uses advanced statistical methods to prevent errors common in traditional analysis. Survivorship bias is the most dangerous noise source: you only see companies that survived, which makes historical returns look better than they were.
- Document your interpretation. Write one paragraph explaining why the data supports or rejects the investment. This step is where most individual investors skip out, and it is the step that separates consistent performers from lucky ones.
- Make a recommendation. Buy, hold, or pass. Assign a price target and a time horizon. If you cannot do this clearly, your analysis is incomplete.
Pro Tip: When you spot a ratio that looks unusually strong, search for the accounting policy behind it. Companies can legally inflate ROE by buying back shares or shifting liabilities off the balance sheet. The footnotes in a 10-K filing are where the real story lives.
What investment frameworks do the best investors actually use?
Data without a decision framework produces analysis paralysis. The investors who consistently outperform use structured models that force a decision at every stage. Warren Buffett's 90/10 portfolio rule, which allocates 90% to a low-cost S&P 500 index fund and 10% to short-term government bonds, is the clearest example of a data-backed strategy that requires almost no rebalancing. It works because it removes the decision points where most investors make emotional errors.
For investors who want more active control, a structured seven-phase framework improves buy, hold, and sell decisions by documenting reasoning and reducing process errors. The phases move from idea generation through due diligence, valuation, position sizing, monitoring, and exit. Each phase has a defined question and a required output before you advance to the next.
The table below summarizes the core phases and what each one demands from you.
| Phase | Key question | Required output |
|---|---|---|
| Idea generation | Why is this opportunity worth investigating? | Written thesis in two sentences |
| Due diligence | Does the business model hold up under scrutiny? | Ratio analysis and competitive review |
| Valuation | What is the intrinsic value and margin of safety? | Discounted cash flow or comparable analysis |
| Position sizing | How much capital is appropriate given my risk tolerance? | Percentage allocation with rationale |
| Monitoring | Is the original thesis still intact? | Quarterly review notes |
| Exit | Has the price reached fair value or has the thesis broken? | Documented sell decision |
Effective investing requires aligning portfolio strategy with life goals, risk tolerance, and emotional capacity rather than chasing market returns alone. Charlie Munger called this "knowing what you own and why you own it." Ray Dalio's All Weather portfolio takes a similar approach by using data on economic regimes to allocate across asset classes rather than predicting market direction. The common thread across Buffett, Munger, and Dalio is that their frameworks reduce the number of decisions, not increase them.
Pro Tip: Write your investment thesis before you buy, and set a calendar reminder to re-read it every 90 days. If you cannot remember why you bought something, that is your signal to review the position, not the price chart.
What do advanced AI tools offer individual investors in 2026?
The most significant shift in data-driven financial planning over the past two years is the arrival of autonomous AI research engines that individual investors can actually access. KelAI, an autonomous AI research engine, creates continuous research loops by generating signals, running backtests and validation, and improving with portfolio manager feedback. What was previously available only to hedge funds is now entering the retail market through platforms built specifically for individual investors.
Here is what advanced AI tools now do that manual analysis cannot match:
- Hypothesis testing at scale. AI engines test hundreds of investment theses simultaneously against historical data, identifying which signals have predictive value and which are coincidental.
- Unstructured document processing. Tools like CambioML extract structured data from earnings call transcripts, 10-K filings, and analyst reports in minutes rather than hours.
- Relationship intelligence. Investors using relationship intelligence platforms increase deal flow by 25% and save over 200 hours annually by automating data entry and contact management. For individual investors building a network of advisors, co-investors, or deal sources, this is a measurable productivity gain.
- Macro regime tracking. Platforms like Kresmion monitor macro regime shifts using congressional trades, whale wallet movements, and 13F filings to surface signals before they appear in mainstream financial media.
- Continuous learning loops. Every hypothesis outcome feeds back into the model, so the system gets more accurate over time rather than requiring manual recalibration.
Poor data management causes missed opportunities and lost productivity, which is why data quality is the first thing to address before deploying any AI tool. Garbage in, garbage out applies to machine learning models more severely than it does to spreadsheets, because AI scales errors as efficiently as it scales insights.
Pro Tip: Use AI tools to generate hypotheses and surface signals, then apply your own judgment to validate them against your financial plan and risk tolerance. The investors who get burned by AI tools are the ones who outsource the decision, not just the analysis.
Common mistakes that undermine data-driven investment strategies
Most investment failures trace back to process failures rather than analytical shortcomings. You can have perfect data and still make a bad decision if your process for using that data is inconsistent or undocumented. The following mistakes are the most common and the most preventable.
- Skipping the written thesis. Investors who do not document their reasoning cannot learn from their mistakes. A written record of why you bought something is the only way to distinguish a good decision with a bad outcome from a bad decision with a good outcome.
- Misaligning data with life goals. Investing without a clear purpose reduces portfolios to collections of accounts. Your data analysis should serve a financial plan, not replace one. Define your time horizon, income needs, and risk capacity before you run a single ratio.
- Using dirty data. Incomplete or inconsistent financial data produces misleading ratios. Always verify your source, check for restatements in prior-year filings, and reconcile figures across at least two independent sources before drawing conclusions.
- Panic-selling during volatility. Emotional discipline improves outcomes more than additional data in high-volatility periods. A psychology check, which means re-reading your original thesis and asking whether the business has changed rather than just the price, is more useful than pulling up a new chart.
- Scaling tools before mastering basics. You only need complex financial analytics tools at scale, specifically for millions of records or real-time processing needs. For smaller portfolios, traditional methods remain viable and cost-effective. Buying enterprise-grade tools before you have a repeatable process is a common and expensive mistake.
The checklist for ongoing monitoring is simple: review your thesis quarterly, check data quality monthly, and run a psychology check any time a position moves more than 15% in either direction.
Key takeaways
Data-driven investing works because it replaces reactive, emotion-driven decisions with a documented, repeatable process grounded in financial evidence and aligned with your personal goals.
| Point | Details |
|---|---|
| Start with the right data sources | Use SEC EDGAR, brokerage statements, and structured financial news before adding complex tools. |
| Follow a seven-step analysis process | Move from data collection through ratio analysis, trend identification, forecasting, and a written recommendation. |
| Use a structured decision framework | Frameworks from Buffett, Munger, and Dalio reduce decision points and limit emotional errors. |
| Match AI tools to your data volume | Advanced AI tools add value at scale; manual methods remain effective for smaller portfolios. |
| Document every decision | Written rationale is the single most impactful habit for improving long-term investment outcomes. |
What I have learned from years of investing with data
The most counterintuitive thing I have found about data-driven investing is that more data does not automatically produce better decisions. Early on, I spent weeks building elaborate spreadsheet models with dozens of variables, only to realize I was using complexity as a substitute for conviction. The investors I respect most carry a short checklist, not a 50-tab workbook.
What actually changed my results was documentation. Writing down why I was buying something, and then forcing myself to re-read that note 90 days later, exposed patterns in my own thinking that no dataset could reveal. I was consistently overweighting recent performance and underweighting balance sheet risk. Seeing that in my own words, repeated across a dozen decisions, was more instructive than any backtesting tool.
I also learned to treat financial planning as the non-negotiable first step. Before I analyze a single ticker, I know my time horizon, my liquidity needs for the next 18 months, and the maximum drawdown I can absorb without changing my behavior. That context transforms data analysis from an abstract exercise into a decision that actually fits my life. Platforms like Kresmion have made the data side significantly faster, but the discipline of connecting data to a personal financial plan is still entirely human work. No tool does that for you.
— Solal
How Kresmion helps individual investors act on data
Individual investors have historically had to choose between expensive institutional data and incomplete retail tools. Kresmion changes that equation by aggregating SEC filings, congressional trades, 13F filings, and whale wallet movements into a single platform built specifically for individual investors.
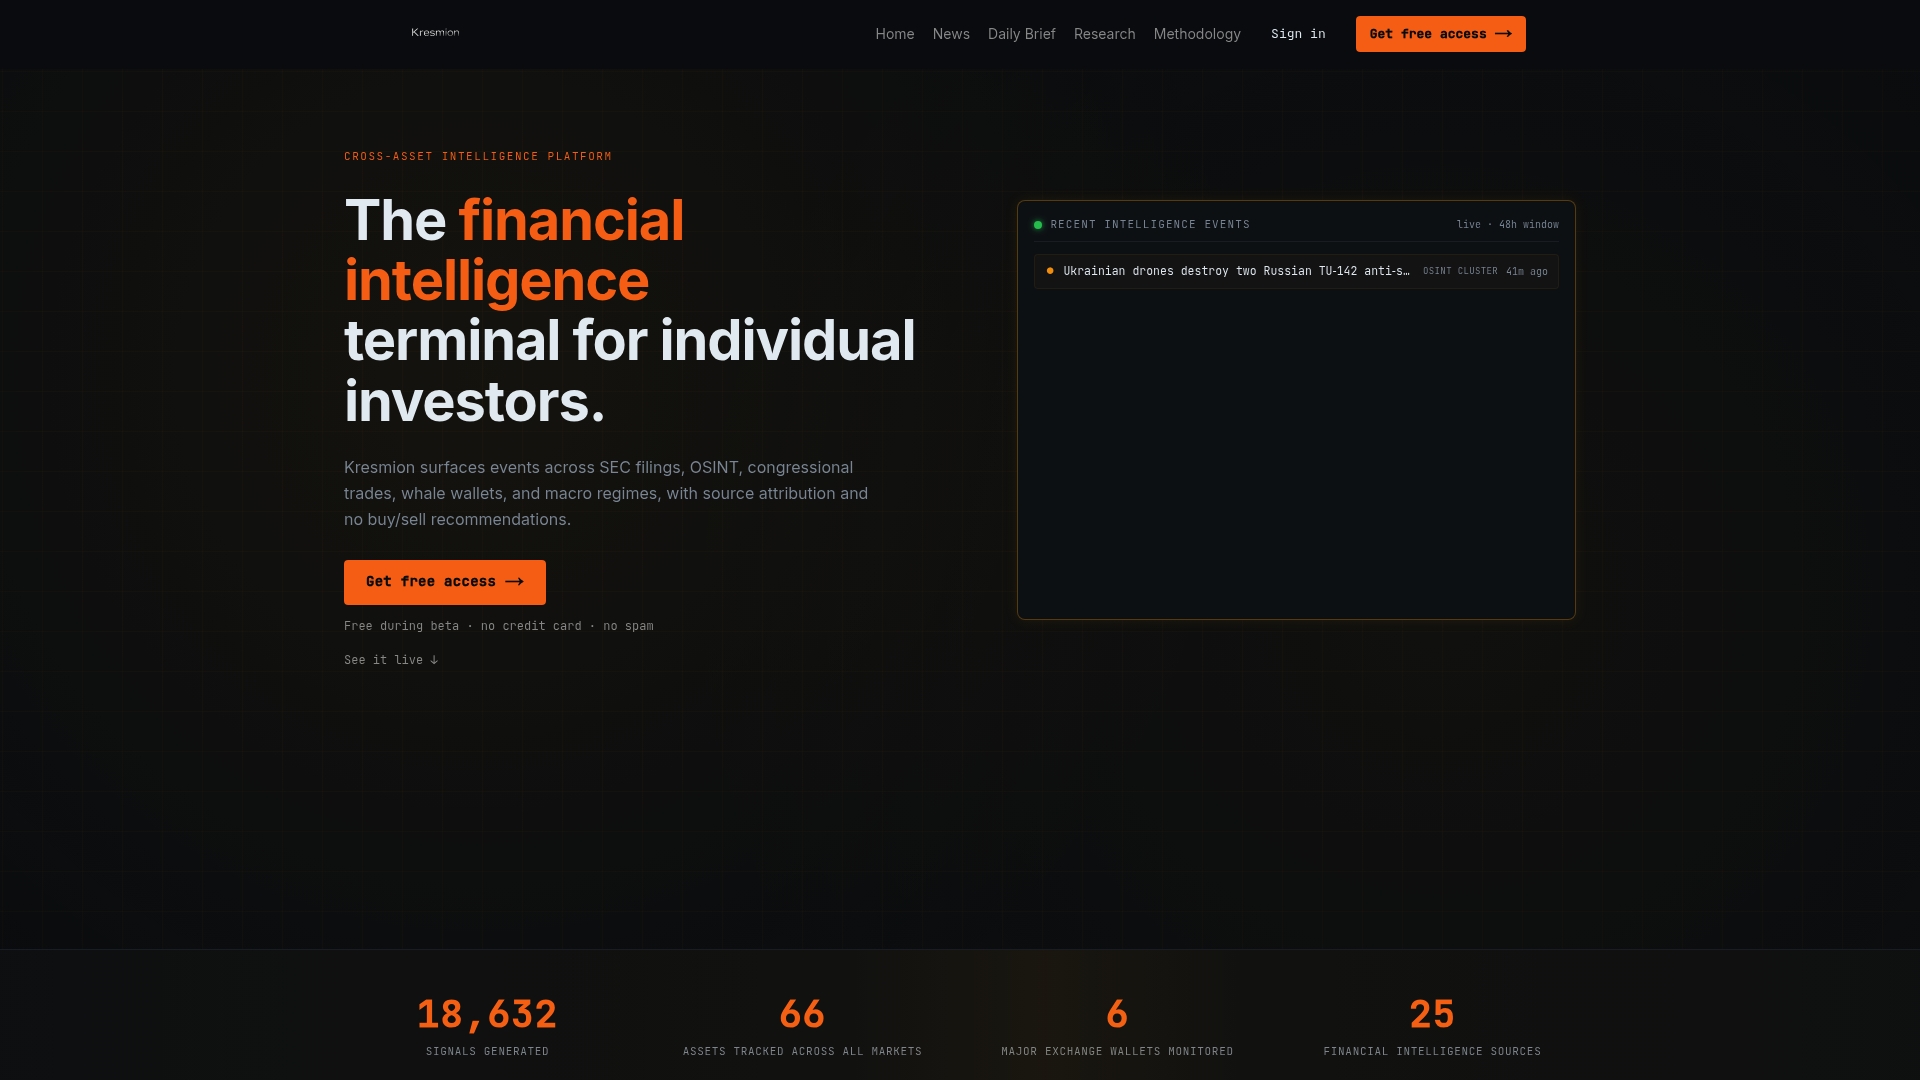
Kresmion surfaces composite signals and macro regime data before they appear in mainstream financial media, giving you the context to evaluate investments with the same depth that institutional traders use. The platform does not push buy or sell recommendations. It gives you the raw data and signals, then lets you apply your own framework and judgment. For investors who want to explore financial intelligence tools built for their level, Kresmion is the starting point. You can also review specific research and 13F filing signals to see how institutional positioning data translates into individual investment context.
FAQ
What does it mean to make data-driven investment decisions?
Data-driven investment decisions use quantitative data, ratio analysis, and structured frameworks to guide buying, holding, and selling rather than relying on intuition or market sentiment. The process includes collecting financial data, running analysis, documenting a thesis, and reviewing decisions against outcomes.
What data sources should individual investors use first?
Start with SEC EDGAR for company filings, your brokerage statements for portfolio data, and structured financial news from Reuters or the Wall Street Journal. These three sources cover the fundamentals before you need to add advanced tools.
How do I avoid emotional decisions during market volatility?
Re-read your original investment thesis before reacting to price movements. Ask whether the underlying business has changed, not just the price. Research confirms that emotional discipline improves outcomes more than additional data during high-volatility periods.
When should I use AI tools instead of manual analysis?
AI tools add measurable value when you are processing large volumes of unstructured documents or need to test multiple investment hypotheses simultaneously. For portfolios under a certain scale, spreadsheet-based analysis remains cost-effective and sufficient.
What is the single most impactful habit for data-driven investors?
Documenting your decision rationale in writing before you execute a trade is the highest-leverage habit. Written records create feedback loops that reveal systematic biases in your thinking, which no amount of additional data can surface on its own.